Watch here or read on for the full story
Is investing in property still as safe as houses?
Two weeks ago almost 1,200 Kiwis signed up for a MoneyHub webinar to hear from Pie about alternatives to investing in property. Why? Well, a lot of Kiwis have most of their wealth tied up in houses, and more and more of them are quietly asking themselves whether that's still as safe as it used to be.
It's true that property has built real wealth for many New Zealand families over the years. But the market has shifted. The better question to ask now is: where is your next dollar best invested?
Start with looking at what you already own. A home plus a rental feels like two investments. In reality it's one bet, made twice.
Take a couple renting, with $300,000 in savings and KiwiSaver. They buy a $1.5 million home. That $300,000 becomes the deposit, and overnight they have five times their life savings riding on one asset.
Ten years later the house is worth $1.8 million, so the bank lends against that gain for the deposit on a $700,000 rental. They now own $2.5 million of property, owe $1.9 million, and even the second deposit came out of the first house.1
Everything in that scenario rises and falls with the same things: one economy, one banking system, one interest rate cycle, one set of tax and tenancy rules. The same economy usually pays the salary that covers the mortgages. In the world of investing, that's what we call concentration risk: all your eggs are in one basket.
Don't get me wrong, property deserves its due because for thirty years everything ran in its favour. Mortgage rates fell from double digits in the early 1990s to record lows in 2021, so buyers could borrow more and pay more.2 Banks lent 80 per cent of the price and gave you decades to repay. The population grew faster than we built houses. Prices rose while the debt that paid for them kept getting cheaper, and that rare combination did most of the work.
That's not the combination we have now. House prices are about 17 per cent below their late-2021 peak and have not set a new high in more than four years, the longest stretch since 1988.3 Prices can certainly rise again, but the old tailwind is largely spent. Mortgage rates are roughly double what they were in 20214 but don't have room to fall by the same extent they did over thirty years.5 The biggest driver of the last boom cannot repeat.
Then there's the leverage factor. On a $1.5 million house with a $300,000 deposit and a $1.2 million mortgage, a 10 per cent rise in price ($150,000) is a 50 per cent return on your deposit money. But leverage works both ways: a 10 per cent fall takes half your money, and the bank still wants its $1.2 million.6
So if property's no longer as attractive as it once was, where else might your next dollar go?
Pie manages share funds so let's start by looking at New Zealand shares.
New Zealand's about 0.1 per cent of the world's sharemarket,7 and the NZX has around 100 companies,8 mostly utilities, property, ports, airports and healthcare. Add New Zealand shares to New Zealand property and you've changed the asset, not the risk. It's still one small economy and one interest rate cycle: concentration in a different wrapper.
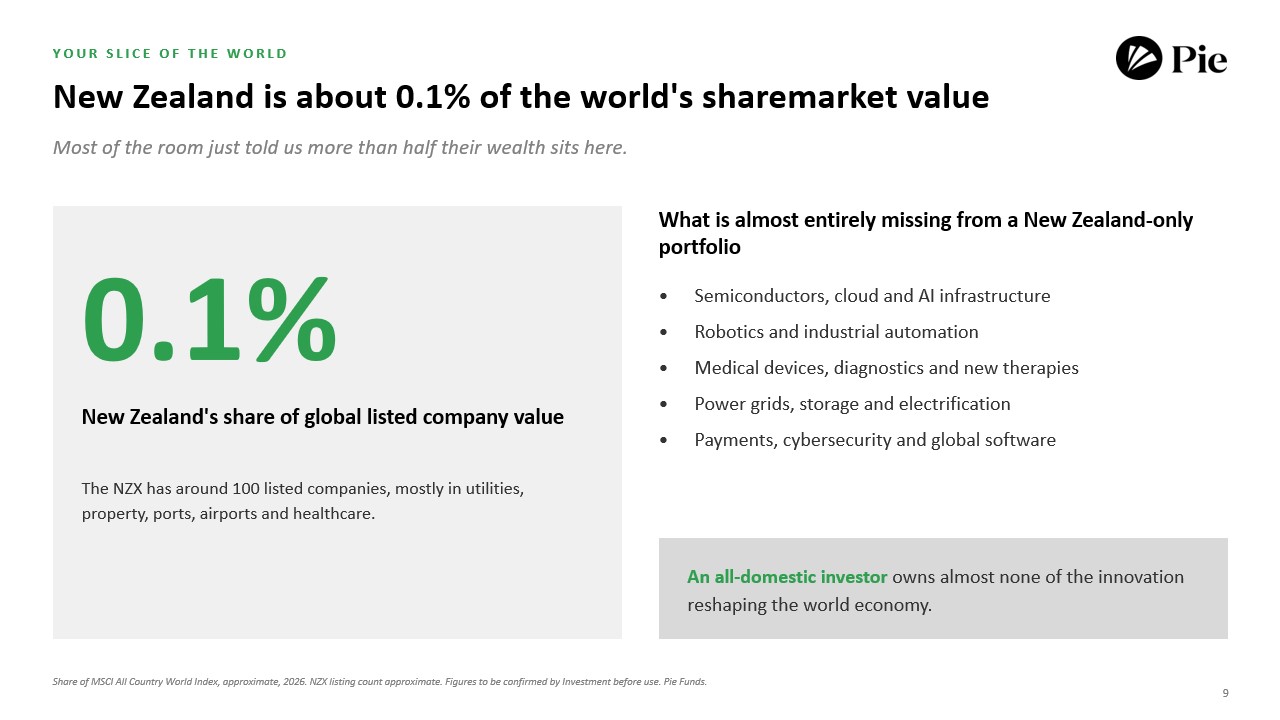
Figure 1. New Zealand's share of global sharemarket value, and what a New Zealand-only portfolio misses out on. Source: MSCI, NZX, Pie Funds. Approximate, 2026.
However, beyond our shores are the businesses driving the mega-trends reshaping how people live, work and spend: the chips and data centres behind artificial intelligence, robotics and automation, medical devices and treatments for ageing populations, the grids and batteries behind electrification, the payment and security systems running global commerce. Almost none of them are listed on the NZX. A house does not get more productive because its price went up – but a business can.
The long run bears this out. If you put $100 into US shares in January 1988, with dividends reinvested it would be worth around $4,900 today: 49 times your money, or 10.7 per cent a year.
Put the same $100 on the New Zealand house price index and it would be worth about $860: 8.6 times, or 5.8 per cent a year.9 Obviously that is not a like-for-like comparison. The share figure includes dividends, the house figure leaves out rent, and neither includes borrowing.
But the shape of the chart is what's important. While both options built real wealth, shares got there faster, and they made you watch every fall along the way.
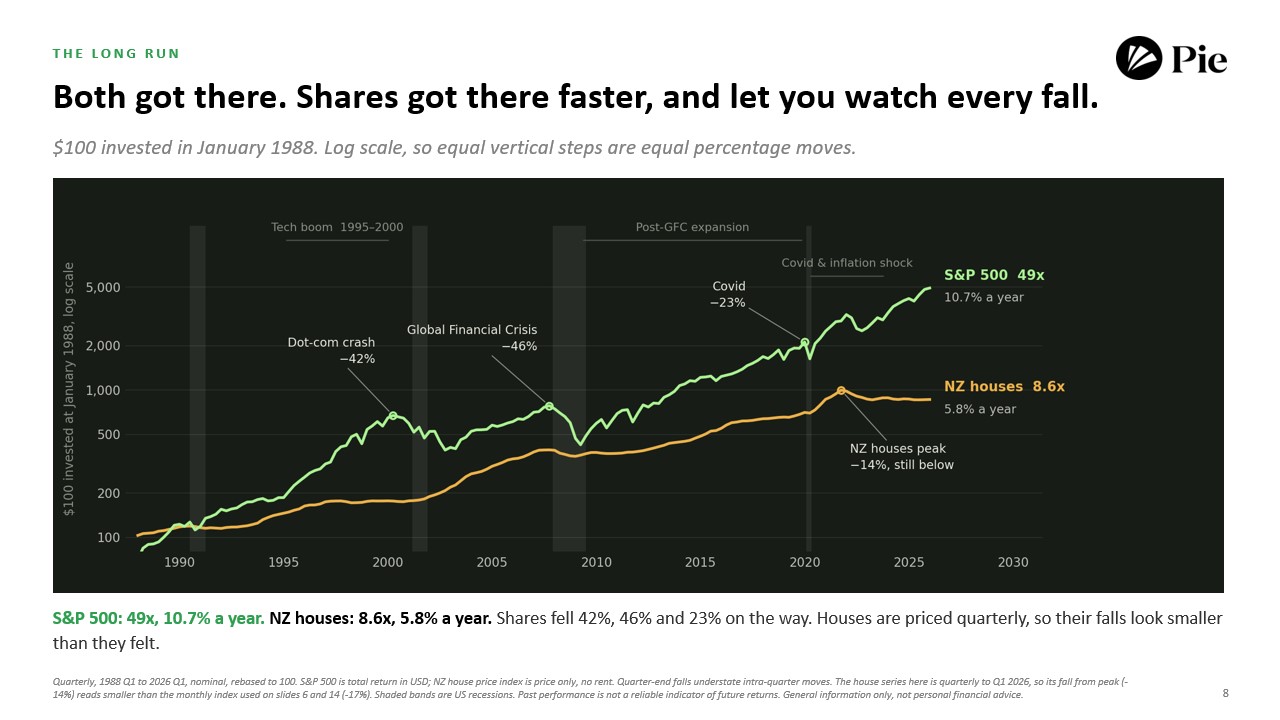
Figure 2. $100 invested in January 1988: S&P 500 (total return, USD) versus the NZ house price index (price only, no rent). Quarterly, nominal, log scale. Source: S&P Dow Jones Indices, REINZ via Bloomberg. Past performance is not a reliable indicator of future returns.
You can't talk about shares without talking about risk. Shares carry plenty of it, and the difference is that you can see it. The US market fell 42 per cent in the Dotcom bust, 46 per cent in the global financial crisis and 23 per cent in Covid, and took about seven years, five years, and six months, respectively, to recover.10 Those recoveries only helped the people who stayed invested through the cycle. If you need your money within three years, it should not all be in shares.
Property's risks are just as real, only quieter: concentration, debt, and the fact that you cannot sell a house in a hurry. Understanding risk means counting both kinds.
I'm not saying the answer for everyone is shares. For some households the best use of the next dollar is paying down the mortgage. For others it's a cash buffer. For some, nothing needs to change. My point is to decide what mix of risks you want to carry before you decide on any particular investment.
So to help you decide I suggest asking yourself three questions:
- What do I already own, counting the home, KiwiSaver and the mortgage?
- What does it all depend on?
- And what risk would this next dollar change?
I can't answer those for you, because I don't know your circumstances.
But almost 1,200 people thought them worth signing up for a webinar, and that tells me something has shifted. For a long time the next dollar went into property because that was simply what Kiwis did. Now people are stopping to ask whether it should.
To me, that's a sign Kiwis are starting to weigh the risks and make better decisions about where to invest their hard earned money and build long term wealth.
1 Illustrative household. Figures are chosen to show the arithmetic and do not describe any individual. The example ignores interest, rates, insurance, maintenance, vacancy and transaction costs. Source: Pie Funds.
2 New Zealand fixed and floating mortgage rates, early 1990s to 2021. [Source to confirm with Investment before publication: Reserve Bank of New Zealand published mortgage rate series.]
3 REINZ House Price Index, monthly, to July 2026, compared with the November 2021 peak. Nominal terms; the fall is larger after inflation. Longest period without a new high in the index since 1988. Source: REINZ via Bloomberg.
4 Approximate comparison of prevailing New Zealand mortgage rates with the 2021 lows. Source: Bloomberg.
5 Pie Funds calculation from the same mortgage rate series as note 2: the fall from double-digit rates in the early 1990s to the record lows of 2021. Approximate.
6 Illustrative only. Ignores interest, rates, insurance, maintenance, vacancy and transaction costs, all of which reduce the return. Source: Pie Funds.
7 New Zealand's weight in the MSCI All Country World Index, approximate, 2026. Source: MSCI.
8 Number of NZX-listed companies, approximate. Source: NZX.
9 $100 rebased at January 1988, quarterly data from Q1 1988 to Q1 2026, nominal. S&P 500 is total return in US dollars, including reinvested dividends. The NZ house price index is price only, with no rent, costs or borrowing. Quarter-end data understates falls within quarters. Source: S&P Dow Jones Indices, REINZ House Price Index via Bloomberg. Past performance is not a reliable indicator of future returns.
10 S&P 500 total return in US dollars, quarterly data. Peak-to-trough falls: Dotcom bust 2000 to 2002, Global Financial Crisis 2007 to 2009, Covid early 2020. Falls measured within quarters were larger. Recovery times to the previous high are approximate. Source: S&P Dow Jones Indices, Bloomberg. Past performance is not a reliable indicator of future returns.
Pie Funds Management Limited (“Pie”) is the issuer and manager of the Pie Funds Management Scheme and the Pie KiwiSaver Scheme (“Schemes”), the product disclosure statements of which can be found at www.piefunds.co.nz. Any advice is given by Pie and is general only. Our advice relates only to the specific financial products mentioned and does not account for personal circumstances or financial goals. Please see a financial adviser for tailored advice. You may have to pay product or other fees, like brokerage, if you act on any advice. As manager of the Schemes, we receive fees determined by your balance and we benefit financially if you invest in our products. We manage this conflict of interest via an internal compliance framework designed to help us meet our duties to you. For information about how we can help you, our duties and complaint process and how disputes can be resolved, or to see our disclosure statement, please visit www.piefunds.co.nz. Please let us know if you would like a hard copy of this disclosure information. Past performance is not a guarantee of future returns. Returns can be negative as well as positive and returns over different periods may vary. The information is given in good faith and has been derived from sources believed to be reliable and accurate. However, neither Pie nor any of its employees or directors gives any warranty of reliability or accuracy and shall not be liable for errors or omissions herein, or any loss or damage sustained by any person relying on such information, whatever the cause of loss or damage. No person, including the directors of Pie, guarantees the repayment of units in the Schemes or any returns of units in the Schemes.